
Cardano van Rossem hard fork reaches mainnet governance
Cardano’s van Rossem hard fork action reaches mainnet, moving Protocol Version 11 toward Dijkstra and Leios while honoring Max van Rossem.
By Olivia Stephanie 6/17/2026, 11:52:20 AM
US and Iran to sign interim peace deal with Pakistan and Qatar representatives present
The interim peace deal could stabilize global oil markets and foster diplomatic engagement, but its success hinges on maintaining the ceasefire. The post US and Iran to sign interim peace deal with Pakistan and Qatar representatives present appeared first on Crypto Briefing.
By Editorial Team 6/17/2026, 11:51:58 AM

The World Cup and XRPPower launch a smart app, enabling XRP or BTC users to earn up to $100000 daily
As BTC and XRP fluctuate, investors are exploring automated platforms like XRPPower for digital asset management and strategy execution. As the World Cup fever sweeps the globe, football has once again become a global focus. Simultaneously, the cryptocurrency market has…
By Guest Post 6/17/2026, 11:51:28 AM

Markus Krösche to remain at Eintracht Frankfurt, rejects AC Milan move
Krsche's decision highlights AC Milan's ongoing struggle to secure leadership, potentially impacting their strategic stability and future success. The post Markus Krösche to remain at Eintracht Frankfurt, rejects AC Milan move appeared first on Crypto Briefing.
By Editorial Team 6/17/2026, 11:46:40 AM

International Energy Agency warns of major oil overhang next year as Iran conflict winds down
The projected oil surplus could lead to decreased prices, impacting global economies, energy policies, and investment in renewables. The post International Energy Agency warns of major oil overhang next year as Iran conflict winds down appeared first on Crypto Briefing.
By Editorial Team 6/17/2026, 11:46:01 AM

Arthur Hayes Adds More ETH After Facing Backlash Over HYPE, ZEC, and WLD
Other big names in the Ethereum ecosystem have also accumulated lately.
By Jordan Lyanchev 6/17/2026, 11:45:07 AM

Bernstein raises AMD price target to $600, betting big on AI chip momentum
AMD's AI-driven growth potential could reshape tech investment strategies, highlighting the increasing importance of AI in market valuations. The post Bernstein raises AMD price target to $600, betting big on AI chip momentum appeared first on Crypto Briefing.
By Editorial Team 6/17/2026, 11:43:38 AM

Trump warns Iran deal is not final ahead of Friday signing, but crypto markets already celebrating
The crypto market's optimism highlights its sensitivity to geopolitical shifts, but unresolved US-Iran issues could still impact future stability. The post Trump warns Iran deal is not final ahead of Friday signing, but crypto markets already celebrating appeared first on Crypto Briefing.
By Editorial Team 6/17/2026, 11:42:16 AM

Manchester United considers Patrick Dorgu’s versatility in transfer plans
Dorgu's versatility could redefine Manchester United's tactical flexibility, offering strategic depth but risking a lack of specialized mastery. The post Manchester United considers Patrick Dorgu’s versatility in transfer plans appeared first on Crypto Briefing.
By Editorial Team 6/17/2026, 11:41:50 AM
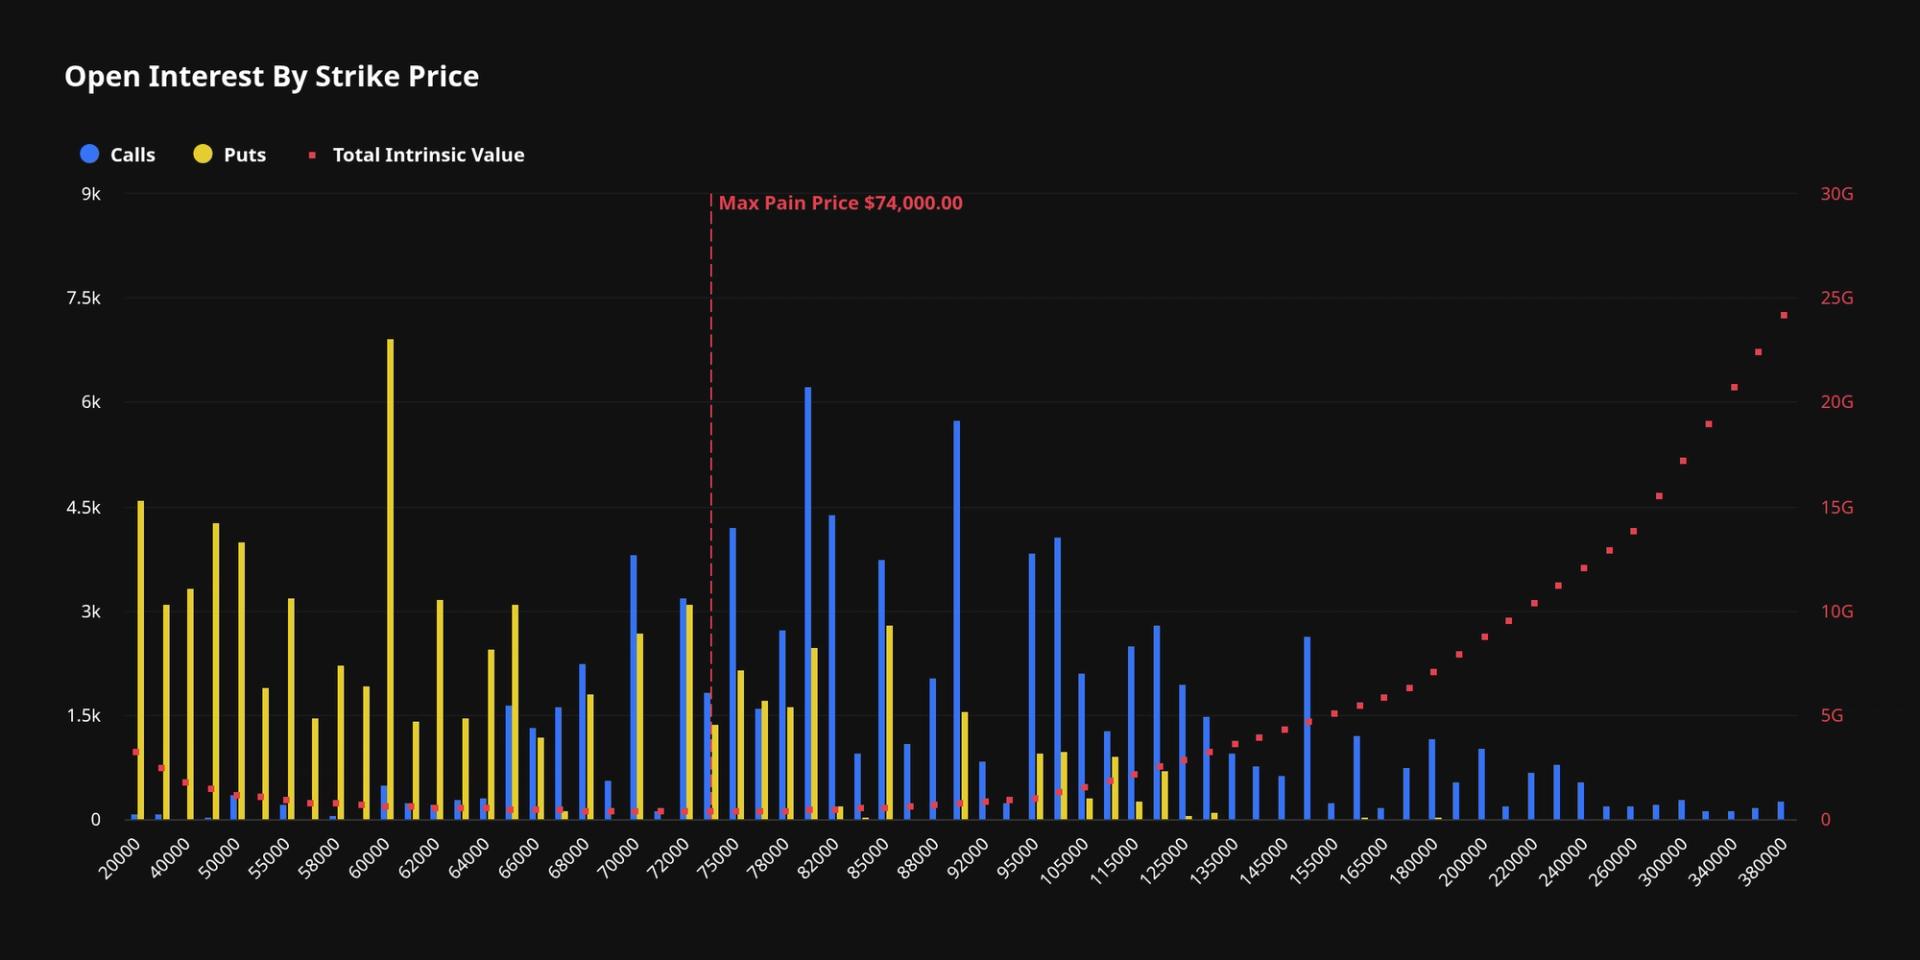
Bitcoin's June downturn leaves $8.6 billion in options out of the money
Only 20% of June 26 options open interest is currently in the money, while bitcoin's 12% monthly decline leaves most bullish positions underwater.
By James Van Straten 6/17/2026, 11:41:06 AM
Donald Trump denies $300B investment fund included in Iran deal
The potential $300B fund could reshape Middle Eastern geopolitics and impact global oil markets, despite US denial of involvement. The post Donald Trump denies $300B investment fund included in Iran deal appeared first on Crypto Briefing.
By Editorial Team 6/17/2026, 11:40:09 AM

Apple investors demand results amid AI initiative discussions
Apple's cautious AI rollout and reliance on external infrastructure may strain investor patience, risking competitive disadvantage and margin pressures. The post Apple investors demand results amid AI initiative discussions appeared first on Crypto Briefing.
By Editorial Team 6/17/2026, 11:39:41 AM

China plans mechanism to assess AI impact on job market
China's proactive AI employment strategy may set a global precedent, prioritizing job stability and innovation in job-creating sectors. The post China plans mechanism to assess AI impact on job market appeared first on Crypto Briefing.
By Editorial Team 6/17/2026, 11:38:05 AM

World Cup 2026 kicks off with Colombia vs Uzbekistan, but crypto’s real play is on the sidelines
The absence of fan tokens for Colombia and Uzbekistan highlights untapped potential in the crypto-sports market, signaling growth opportunities. The post World Cup 2026 kicks off with Colombia vs Uzbekistan, but crypto’s real play is on the sidelines appeared first on Crypto Briefing.
By Editorial Team 6/17/2026, 11:35:47 AM
Exclusive: Bitcoin, Ethereum, and XRP Price Predictions – Key Levels to Watch
The post Exclusive: Bitcoin, Ethereum, and XRP Price Predictions – Key Levels to Watch appeared first on Coinpedia Fintech News In a discussion with Coinpedia, crypto analyst Kripto Holder shared his latest assessment of Bitcoin, arguing that the market is currently going through a phase of liquidity gathering and leverage reduction rather than a...
By Qadir AK 6/17/2026, 11:30:51 AM

Uber Technologies to offer driverless robotaxi rides in Houston next year
Uber's driverless expansion in Houston could revolutionize urban mobility, impacting labor markets and accelerating autonomous tech adoption. The post Uber Technologies to offer driverless robotaxi rides in Houston next year appeared first on Crypto Briefing.
By Editorial Team 6/17/2026, 11:30:37 AM
Heir to 135-year Gulf dynasty is moving a $6 trillion trade market onto blockchain rails
Abdulla Kanoo says his ARP Digital firm is building settlement infrastructure for the growing flow of trade between emerging economies, a market that could reach $32 trillion by 2030.
By Olivier Acuna 6/17/2026, 11:30:37 AM

CZ Calls Hyperliquid’s Innovation ‘Awesome’ While Uniswap’s Hayden Adams Blasts US Securities Law
Binance’s CZ praised rival Hyperliquid as “actually awesome” even as he said he would never run it the same way, while Uniswap creator Hayden Adams argued U.S. securities law ensures “only people who are already millionaires can invest in startups.” CZ: ‘A Niche Binance Cannot Compete In’ In his appearance on the Galaxy Brains podcast, […]
By Shiraz Jagati 6/17/2026, 11:30:25 AM

Uniswap price surges 25% as Standard Chartered’s $100 UNI call sparks breakout
Uniswap has surged more than 25% on Wednesday after Standard Chartered initiated coverage of UNI with a $100 price target for 2030, triggering one of the strongest rallies among large-cap cryptocurrencies this week. According to data from crypto.news, Uniswap (UNI)…
By Rony Roy 6/17/2026, 11:30:00 AM

Jeff Bezos highlights cost as barrier to orbital data centers, says science isn’t the problem
The high costs of orbital data centers could delay their development, impacting the pace of innovation in space-based AI infrastructure. The post Jeff Bezos highlights cost as barrier to orbital data centers, says science isn’t the problem appeared first on Crypto Briefing.
By Editorial Team 6/17/2026, 11:29:32 AM

Trump clarifies Iran deal excludes $300B investment fund from US taxpayers
The clarification may ease geopolitical tensions, influencing oil and crypto markets, but political debates over Iran's asset release persist. The post Trump clarifies Iran deal excludes $300B investment fund from US taxpayers appeared first on Crypto Briefing.
By Editorial Team 6/17/2026, 11:28:47 AM

Jude Bellingham aims to shine for England at World Cup, but crypto markets are already speculating
The $JUDE token's collapse highlights the risks of speculative crypto markets exploiting sports hype without official backing. The post Jude Bellingham aims to shine for England at World Cup, but crypto markets are already speculating appeared first on Crypto Briefing.
By Editorial Team 6/17/2026, 11:25:09 AM

DP World seeks return to US port operations after 20-year absence
DP World's potential US return could boost American port infrastructure investment, blending traditional logistics with innovative tech solutions. The post DP World seeks return to US port operations after 20-year absence appeared first on Crypto Briefing.
By Editorial Team 6/17/2026, 11:23:25 AM

Stanford researcher releases SEFD dataset for machine-readable SEC filings
The SEFD dataset could democratize financial data access, enhancing AI-driven analysis while necessitating robust validation to mitigate errors. The post Stanford researcher releases SEFD dataset for machine-readable SEC filings appeared first on Crypto Briefing.
By Editorial Team 6/17/2026, 11:23:14 AM
Andrew Tate faces another liquidation on $3.76M BTC long
Andrew Tate’s 40x Bitcoin long faces another partial liquidation as Lookonchain tracks his latest Hyperliquid BTC trade and risk level.
By Olivia Stephanie 6/17/2026, 11:21:38 AM

Croatia faces England in 2026 World Cup opener as crypto tokens ride Modric’s farewell tour
The intertwining of sports and crypto highlights evolving fan engagement and investment dynamics, with potential shifts in digital asset value. The post Croatia faces England in 2026 World Cup opener as crypto tokens ride Modric’s farewell tour appeared first on Crypto Briefing.
By Editorial Team 6/17/2026, 11:19:01 AM

Chelsea plans for Geovany Quenda to join first-team squad next season
Chelsea's direct integration of Quenda into the first team signals a shift towards prioritizing long-term player development over short-term loans. The post Chelsea plans for Geovany Quenda to join first-team squad next season appeared first on Crypto Briefing.
By Editorial Team 6/17/2026, 11:17:53 AM
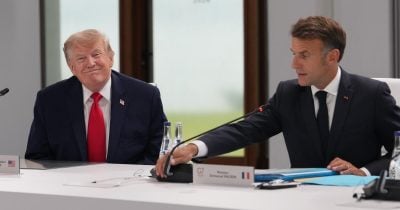
Donald Trump asserts leadership at G7, pledges support for Ukraine alongside new Russia sanctions
Trump's G7 leadership may heighten geopolitical tensions, impacting global markets, crypto regulations, and energy prices amid Russia sanctions. The post Donald Trump asserts leadership at G7, pledges support for Ukraine alongside new Russia sanctions appeared first on Crypto Briefing.
By Editorial Team 6/17/2026, 11:17:48 AM

Chelsea’s Xabi Alonso monitors Nicolas Jackson’s World Cup form ahead of crucial pre-season decision
Alonso's evaluation of Jackson's World Cup form could shape Chelsea's strategic decisions, impacting their long-term squad development. The post Chelsea’s Xabi Alonso monitors Nicolas Jackson’s World Cup form ahead of crucial pre-season decision appeared first on Crypto Briefing.
By Editorial Team 6/17/2026, 11:16:29 AM
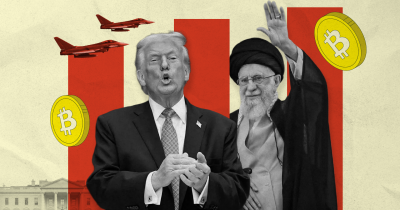
Trump threatens to resume bombing Iran if MOU terms aren’t met, Bitcoin rallies on ceasefire hopes
The geopolitical tension underscores the fragility of international agreements, influencing global markets and highlighting crypto's sensitivity to risk sentiment. The post Trump threatens to resume bombing Iran if MOU terms aren’t met, Bitcoin rallies on ceasefire hopes appeared first on Crypto Briefing.
By Editorial Team 6/17/2026, 11:15:49 AM
Three Fed signals that could make bitcoin pop
Your day-ahead look for June 17, 2026
By Omkar Godbole 6/17/2026, 11:15:00 AM

Investors await Kevin Warsh’s stance on Fed’s 2% inflation goal
Warsh's potential shift to trimmed-mean inflation could ease monetary policy, impacting interest rates, market stability, and crypto adoption. The post Investors await Kevin Warsh’s stance on Fed’s 2% inflation goal appeared first on Crypto Briefing.
By Editorial Team 6/17/2026, 11:14:37 AM

Trump says Iran deal does not include immediate sanctions relief, deferring key decisions
The phased approach maintains leverage over Iran, impacting global markets and crypto, while signaling ongoing US scrutiny of digital assets. The post Trump says Iran deal does not include immediate sanctions relief, deferring key decisions appeared first on Crypto Briefing.
By Editorial Team 6/17/2026, 11:12:02 AM

Thomas Tuchel leads England national football team at World Cup, marking a first for German coaching in English football
Tuchel's leadership could redefine England's football identity, challenging traditional norms and potentially inspiring broader coaching diversity. The post Thomas Tuchel leads England national football team at World Cup, marking a first for German coaching in English football appeared first on Crypto Briefing.
By Editorial Team 6/17/2026, 11:08:04 AM
SHIB Loses Track to $0.000006 as Exchange Flow Makes Bearish U-Turn
Shiba Inu halts potential recovery as price flips negative again while exchange flow shows that sellers are returning to the market with billions of SHIB sold.
By Caroline Amosun 6/17/2026, 11:07:07 AM
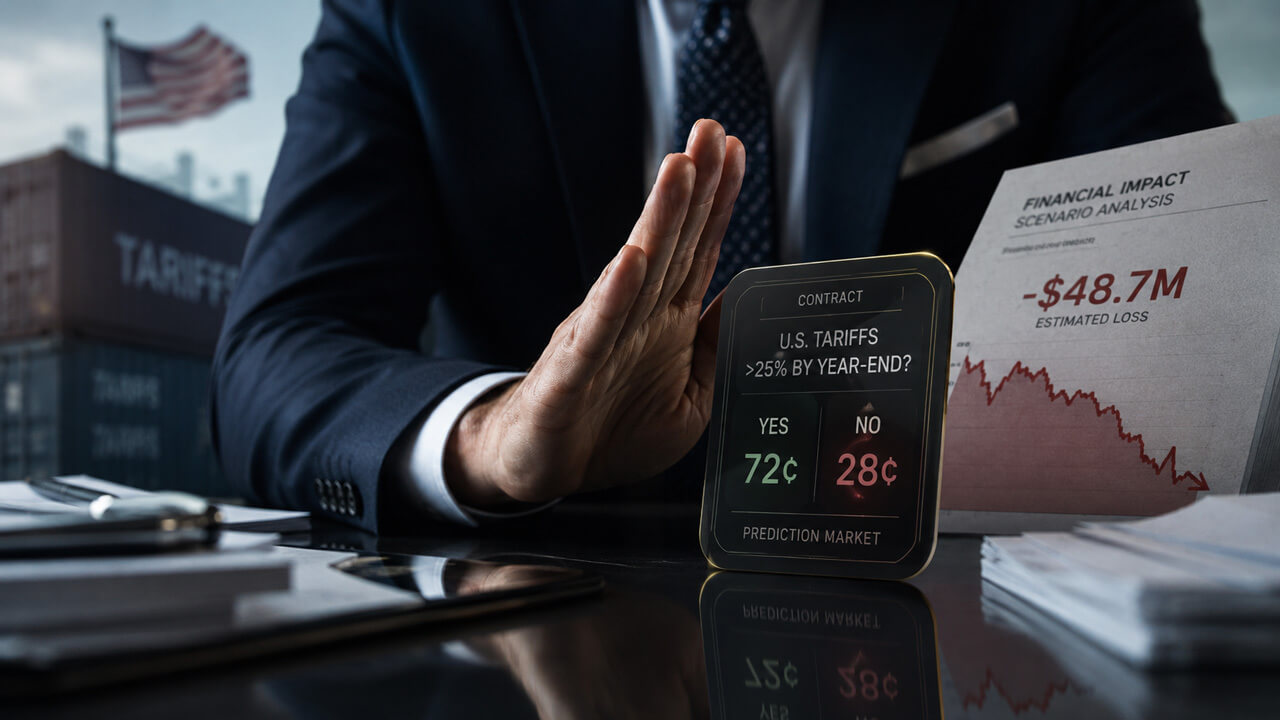
Prediction markets can hedge corporate losses – Who decides if they pay out?
A trading desk facing a possible $1 million loss if a specific tariff takes effect by the third quarter typically hedges that risk through currency or commodity proxies, instruments that move with the broader noise around a tariff decision. A prediction market contract skips the proxy by letting the desk buy I heard it the […] The post Prediction...
By Gino Matos 6/17/2026, 11:05:30 AM

What is Gram? The complete guide to the Toncoin rebrand
On June 15, 2026, Toncoin became Gram, reclaiming the name regulators erased in 2020. Here is the full story: what changed, what did not, the six-year history behind it, how Gram works, how to buy it, and whether it is…
By Rony Roy 6/17/2026, 11:03:09 AM

China pays closer attention to stablecoins as cross-border role expands
A senior PBOC official called for closer monitoring, stronger regulation and international coordination as stablecoins gain importance in global payments.
By Ezra Reguerra 6/17/2026, 11:02:46 AM

Bitcoin is setting up 'meaningful floors' in $60K–$70K range: Analyst
Bitcoin’s $6000–$70,000 cost-basis cluster hints at a bottom, but a bearish daily flag keeps BTC exposed to a deeper selloff toward $50,000.
By Yashu Gola 6/17/2026, 11:02:08 AM

G7 countries set 60% import limit on critical minerals by 2030
The G7's import limit on critical minerals aims to reduce dependency on dominant suppliers, potentially reshaping global supply chains and markets. The post G7 countries set 60% import limit on critical minerals by 2030 appeared first on Crypto Briefing.
By Editorial Team 6/17/2026, 11:01:54 AM
Toobit Takes Hedgeweek’s Top Derivatives Prize for the Second Year Running
Toobit has been named Digital Asset Derivatives Platform of the Year at the 2026 Hedgeweek Global Digital Assets Awards – the second consecutive year the exchange has claimed the title. The winners were announced at an exclusive ceremony held on June 9 at etc.venues, County Hall, London. Judging for the awards was conducted via a […] The post...
By alan 6/17/2026, 11:01:37 AM

Trump delays confirmation hearing for Jay Clayton as US intelligence chief
Trump's delay in Clayton's hearing highlights the strategic use of political leverage, potentially impacting legislative priorities and crypto oversight. The post Trump delays confirmation hearing for Jay Clayton as US intelligence chief appeared first on Crypto Briefing.
By Editorial Team 6/17/2026, 11:01:04 AM
Cardano Hits Major Milestone on Road to Dijkstra Era
Cardano's Dijkstra era will ultimately bring a major scalability upgrade, Leios, to the mainnet.
By Tomiwabold Olajide 6/17/2026, 11:00:43 AM

Bitget EU files MiCAR application with Austria’s FMA
Bitget EU files its MiCAR application with Austria’s FMA as the exchange says existing global user access remains under current terms online
By Olivia Stephanie 6/17/2026, 11:00:00 AM

Iran, US agree on ceasefire, Strait of Hormuz reopening, financial relief
The agreement may enhance regional stability, impacting global markets and diplomatic relations, though unresolved issues could pose challenges. The post Iran, US agree on ceasefire, Strait of Hormuz reopening, financial relief appeared first on Crypto Briefing.
By Estefano Gomez 6/17/2026, 10:56:26 AM

Standard Chartered Sees Uniswap Rising To $100 By 2030 On RWA Growth
Standard Chartered has reportedly set a long-term $100 target for Uniswap by 2030, tied to rapid growth in tokenized real-world assets.
By NewsBTC Editorial Team 6/17/2026, 10:55:07 AM

Poland acquires stake in AI voice company ElevenLabs to boost tech hub ambitions
Poland's investment in ElevenLabs could accelerate its tech hub status but raises regulatory challenges amid evolving EU AI laws. The post Poland acquires stake in AI voice company ElevenLabs to boost tech hub ambitions appeared first on Crypto Briefing.
By Editorial Team 6/17/2026, 10:53:38 AM
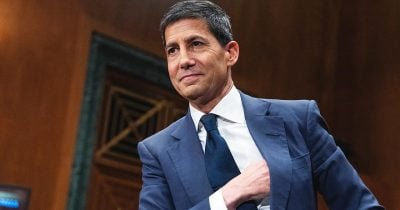
Fed Chair Kevin Warsh confronts rising inflation and fading rate cut hopes at first policy meeting
Warsh's leadership amid inflation and geopolitical tensions could redefine Fed's policy approach, impacting global markets and risk assets. The post Fed Chair Kevin Warsh confronts rising inflation and fading rate cut hopes at first policy meeting appeared first on Crypto Briefing.
By Editorial Team 6/17/2026, 10:51:22 AM

Luka Modric aims to thwart England’s World Cup hopes at 40, and crypto is paying attention
Modric's World Cup presence at 40 highlights crypto's increasing influence in sports, signaling a shift in sponsorship dynamics and fan engagement. The post Luka Modric aims to thwart England’s World Cup hopes at 40, and crypto is paying attention appeared first on Crypto Briefing.
By Editorial Team 6/17/2026, 10:49:41 AM

US-Iran memorandum signing imminent, includes ceasefire and sanctions relief
The memorandum could reshape Middle Eastern geopolitics, impacting global markets and diplomatic relations, with potential regional stabilization. The post US-Iran memorandum signing imminent, includes ceasefire and sanctions relief appeared first on Crypto Briefing.
By Estefano Gomez 6/17/2026, 10:49:40 AM